PRESS RELEASE
May 13, 2026
Contact: Sam Stockwell
samuel_stockwell@gse.harvard.edu
617.495.0342
South Carolina Ranks 15th in Math Recovery Among States, with Districts on the Rise Emerging Across the State
South Carolina’s math recovery ranks in the top third nationally, with students closing in on 2019 levels.
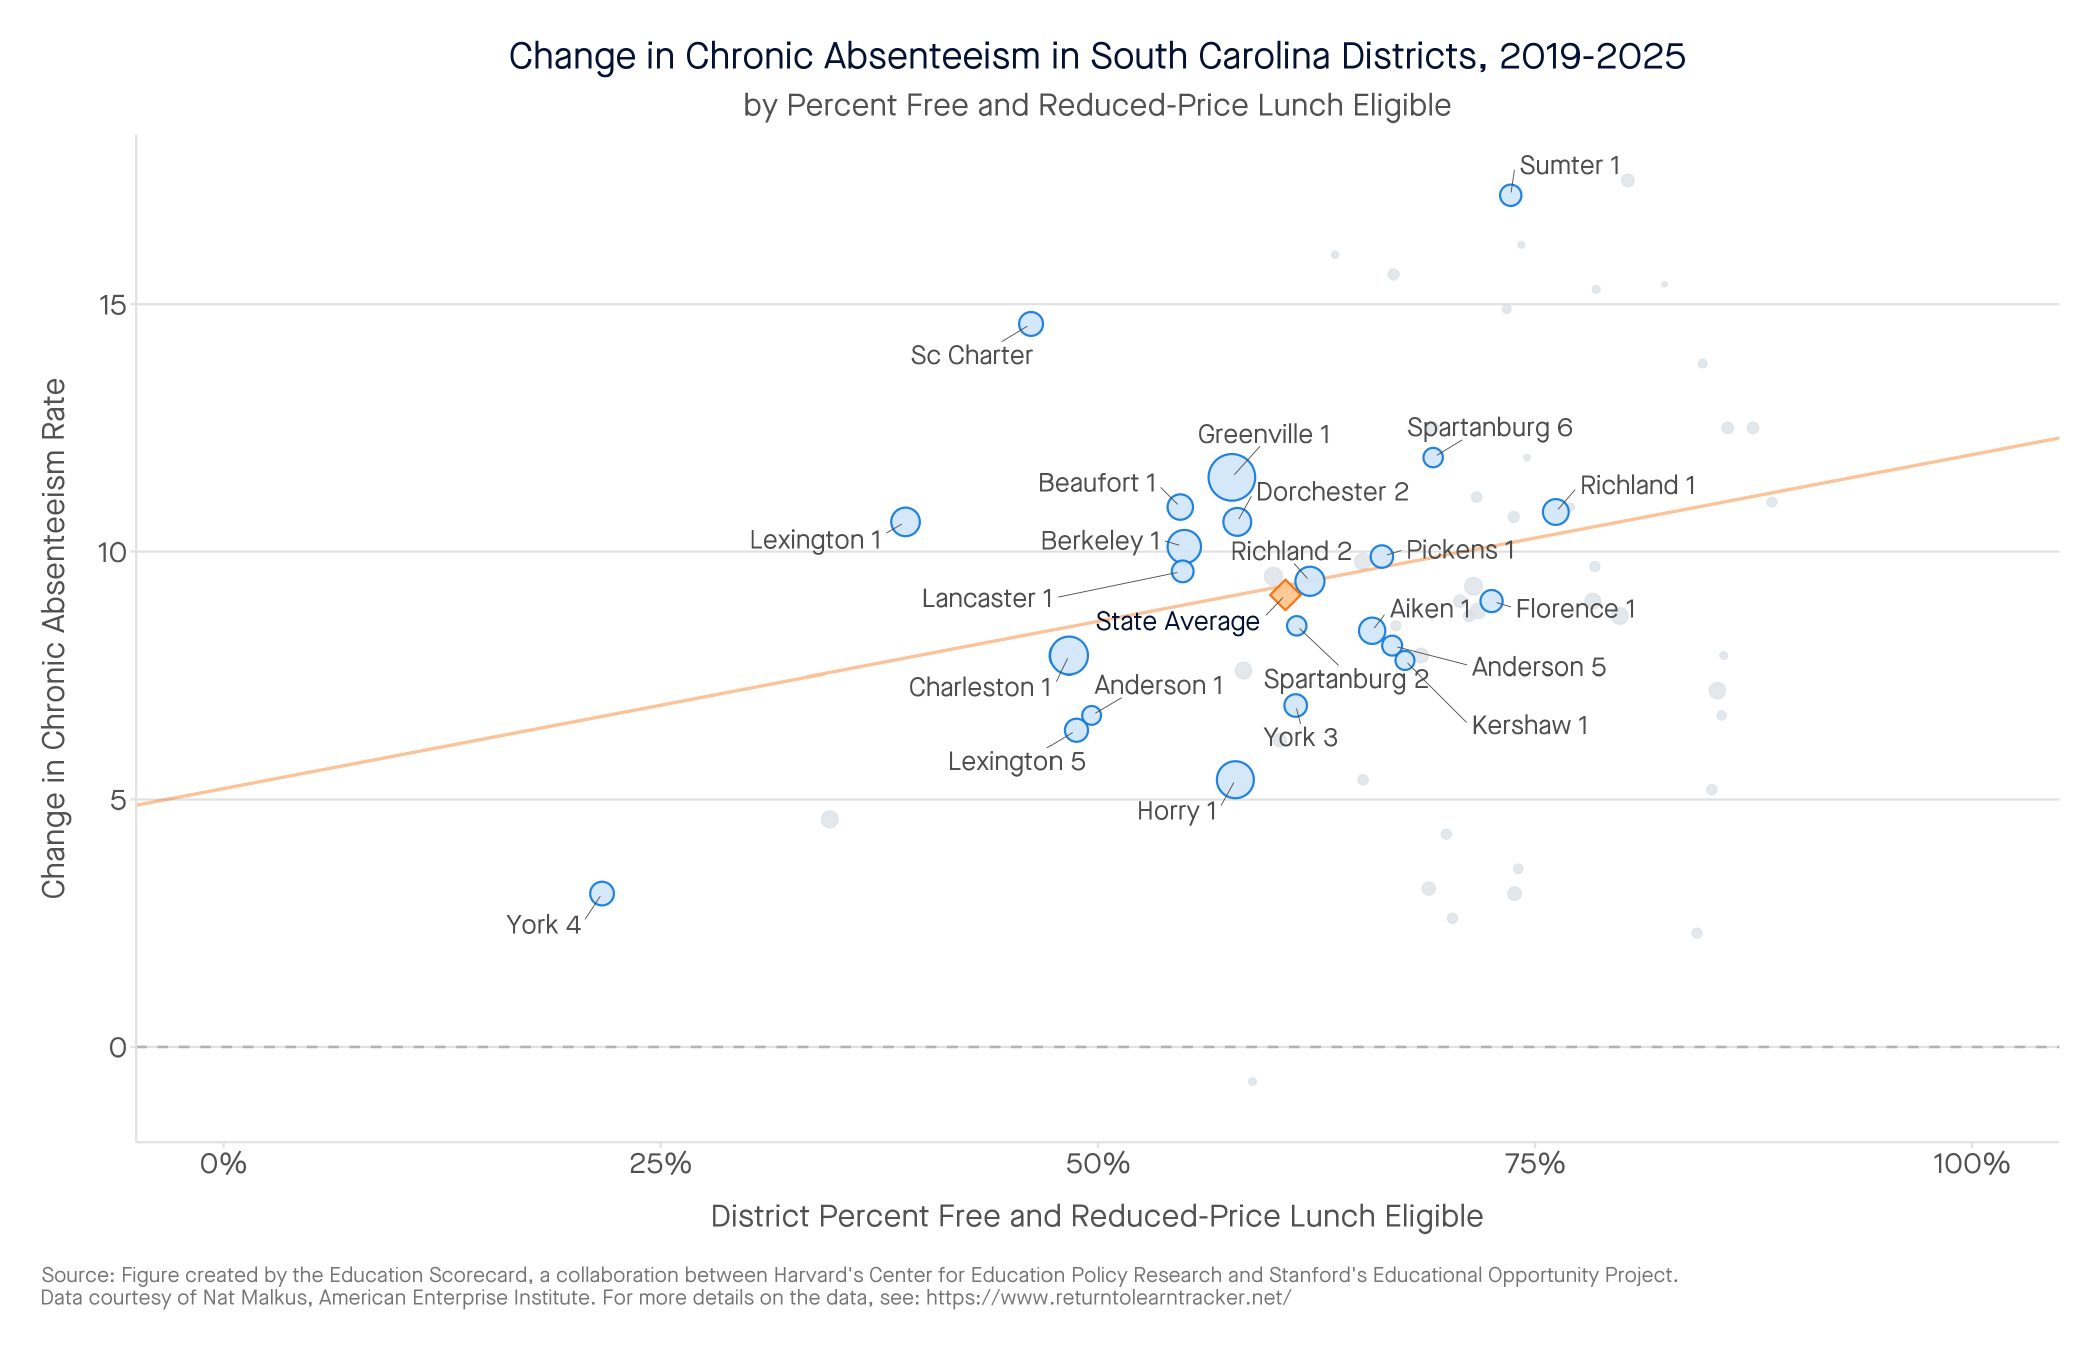
Chronic absenteeism remains about 10 percentage points above pre-pandemic levels and continues to pose a significant challenge.
Greenwood 50, Anderson 04, and Florence 01 are outperforming their peers in math.
(May 13, 2026) In its fourth year, the Education Scorecard (a collaboration between the Center for Education Policy Research at Harvard University, The Educational Opportunity Project at Stanford University, and faculty at Dartmouth College) is issuing its annual report on district-level student growth in math and reading.
The latest report provides a high-resolution picture of where South Carolina students’ academic recovery stands, combining state test results for roughly 35 million grade 3–8 students nationwide with national assessment data to describe changes in local communities. Here’s what we found:
South Carolina:
- South Carolina ranks 15th out of 38 states in academic growth in math between 2022 and 2025.
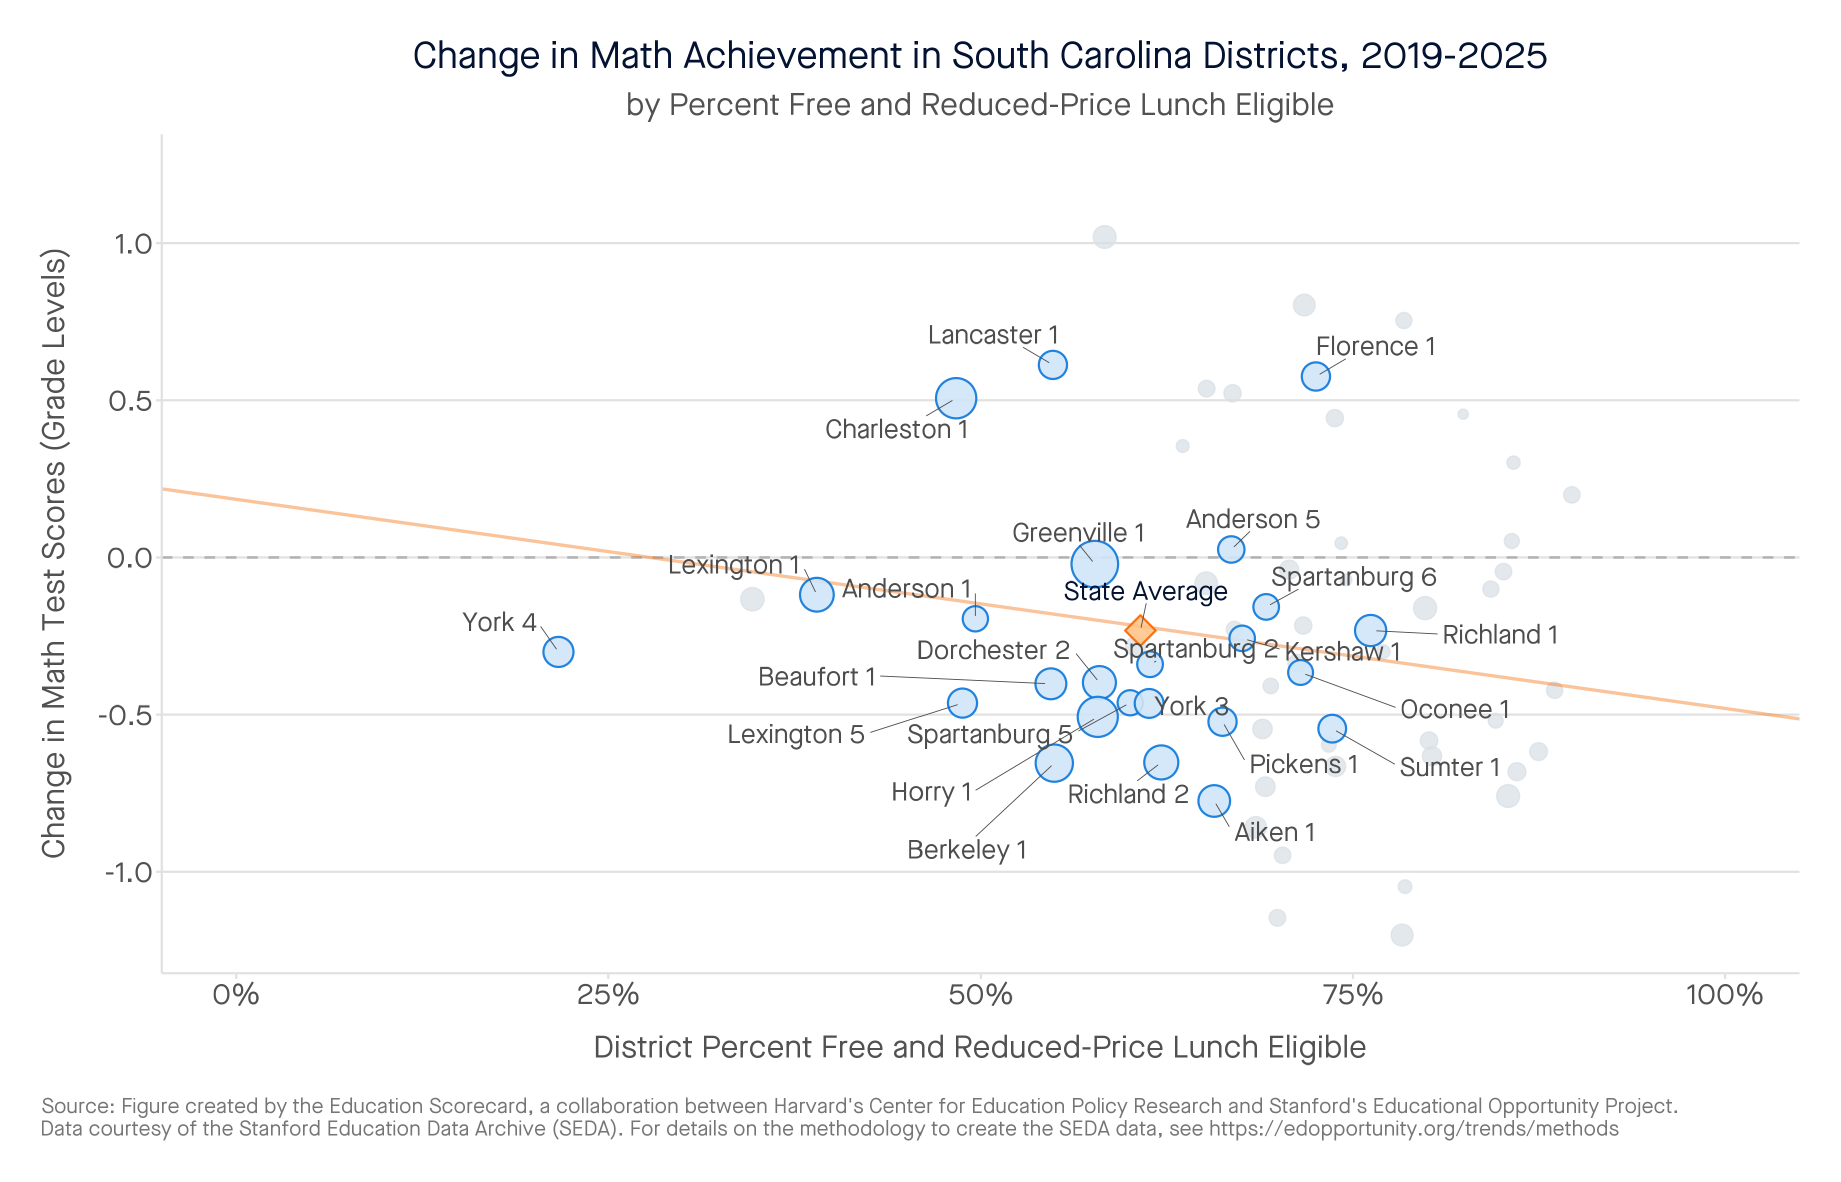
- In math, the average student is performing about .2 grade equivalents above their 2022 level, but .23 grade equivalents below 2019 levels. Still, some districts like Berkeley 1, Aiken 1, and Richland 2 continue to lag behind 2019 levels.
- Several South Carolina districts are emerging as Districts on the Rise. These districts have shown unusual progress relative to similar districts in their own state. A core group of districts is excelling in math, with districts like Greenwood 50, Anderson 04, and Florence 01 outperforming their peers.
- Statewide, chronic absenteeism (students missing more than 10% of a school year) continues to be a problem, hovering around 22%—about 10 percentage points above pre-pandemic levels.
- South Carolina received about $3.27 billion in federal pandemic relief for K–12 schools—roughly $4,200 per student. Our analysis finds the gains in many high-poverty districts were driven by this federal support. Unfortunately, many middle-poverty districts (those with 30 to 70 percent of students receiving federal lunch subsidies) received little federal aid. Now that the federal relief is gone, South Carolina should focus school improvement dollars on the middle and higher poverty districts that remain behind their pre-pandemic levels.
“The pandemic was the mudslide that followed seven years of erosion in student achievement,” said Professor Tom Kane, faculty director of the Center for Education Policy Research at Harvard University. “The ‘learning recession’ started a decade ago, after policymakers switched off the early warning system of test-based accountability and social media took over children’s lives. In this report, we highlight the work of a small group of state leaders who have started digging out by changing how students learn to read, and 108 local school districts that are finding ways to get students learning again. The recovery of U.S. education has begun. But it’s up to the rest of us to spread it.”