PRESS RELEASE
May 13, 2026
Contact: Sam Stockwell
samuel_stockwell@gse.harvard.edu
617.495.0342
West Virginia Ranks 6th in Math and 8th in Reading Recovery Among States
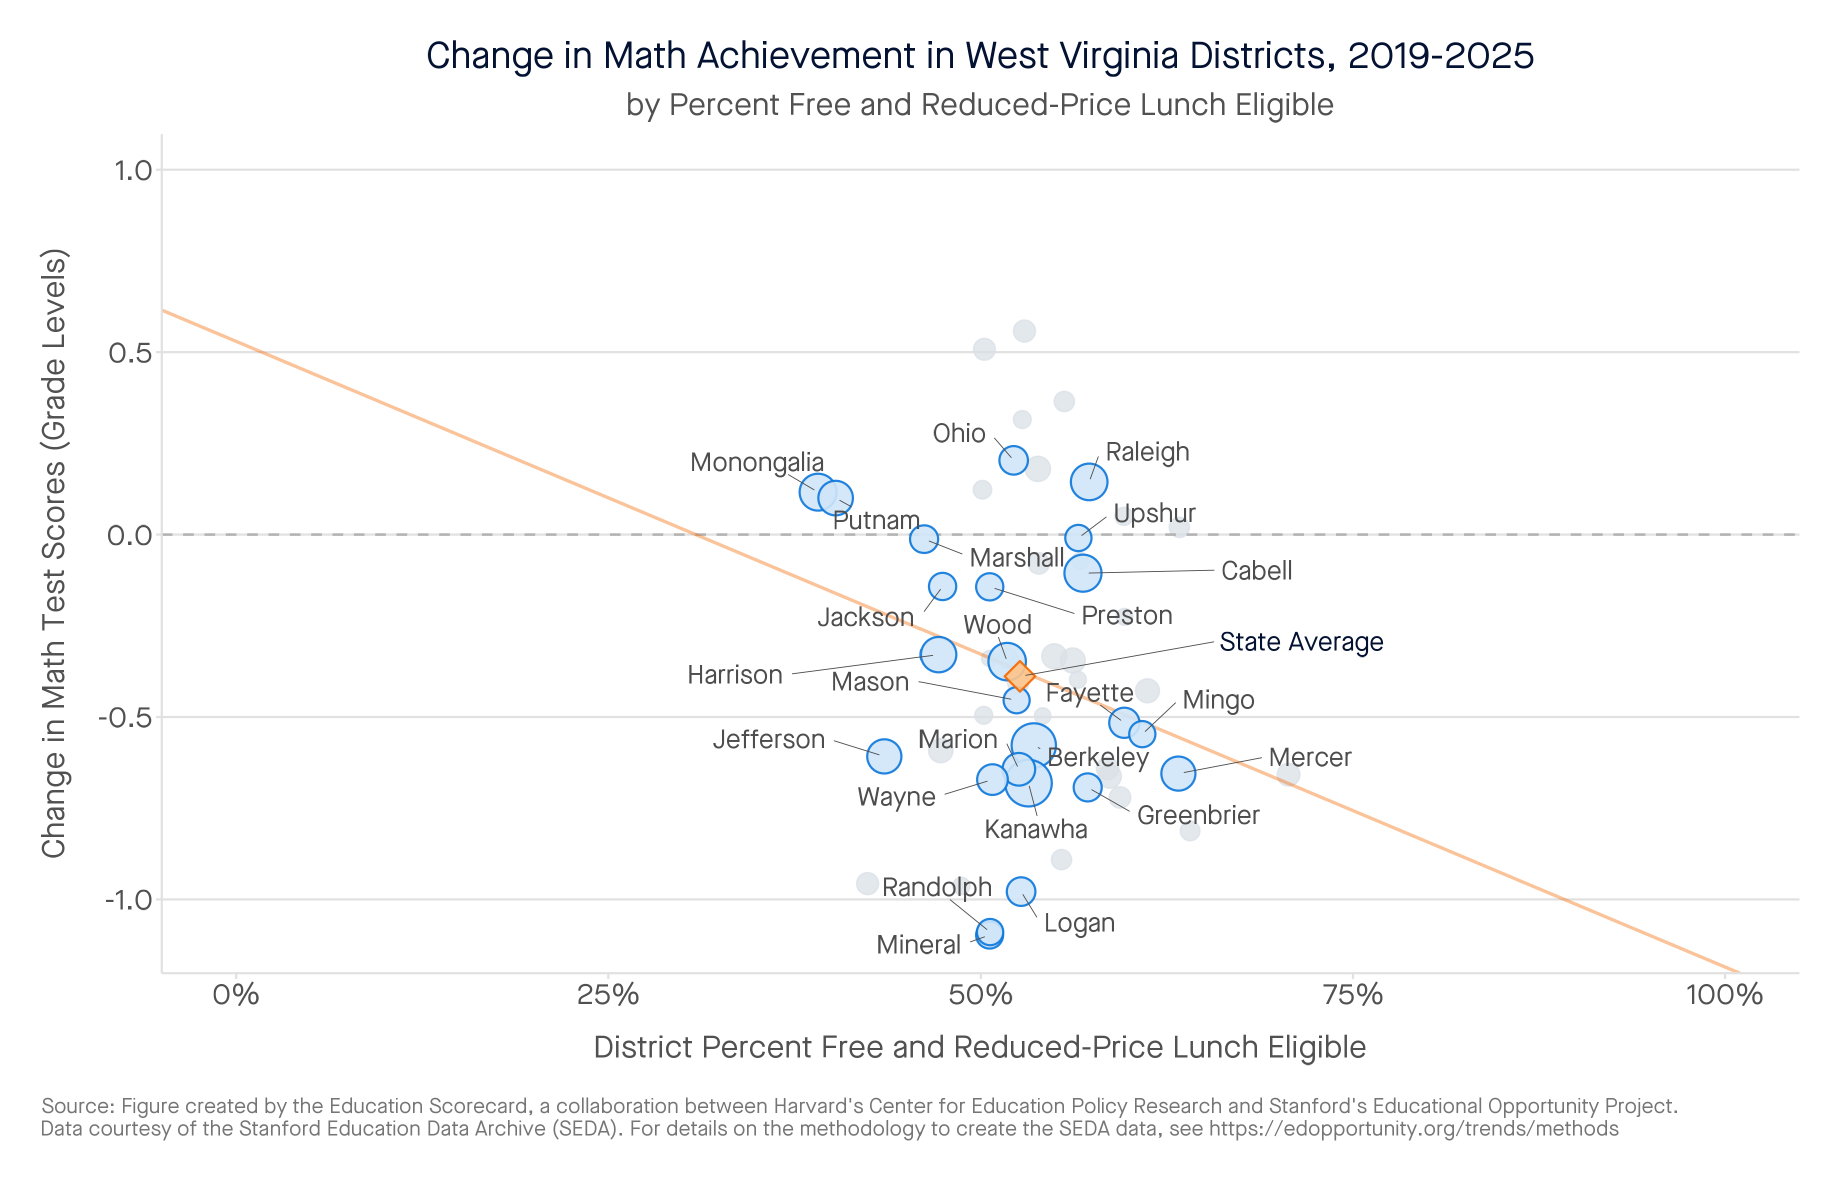
Upshur County, Harrison County, and Ohio County are leading the way in math performance.
Despite strong recovery gains, students remain .4 grade equivalents below 2019 levels in math and .68 below in reading, with substantial work ahead.
(May 13, 2026) In its fourth year, the Education Scorecard (a collaboration between the Center for Education Policy Research at Harvard University, The Educational Opportunity Project at Stanford University, and faculty at Dartmouth College) is issuing its annual report on district-level student growth in math and reading.
The latest report provides a high-resolution picture of where West Virginia students’ academic recovery stands, combining state test results for roughly 35 million grade 3–8 students nationwide with national assessment data to describe changes in local communities. Here’s what we found:
West Virginia:
- West Virginia ranks 6th out of 38 states in academic growth in math and 8th out of 35 states in reading between 2022 and 2025.
- In math, the average student is performing .4 grade equivalents above their 2022 level, but remains .4 grade equivalents below 2019 levels. Some districts like Randolph and Mineral continue to lag more than a full grade equivalent behind 2019 levels.
- In reading, the average student is performing just above their 2022 level, but still remains .68 grade equivalents below 2019 levels.
- Several West Virginia districts are emerging as Districts on the Rise, showing unusual progress relative to similar districts in their own state.
- Several districts are rising relative to their peers in math. Upshur County, Harrison County, and Ohio County are leading the way in math performance.
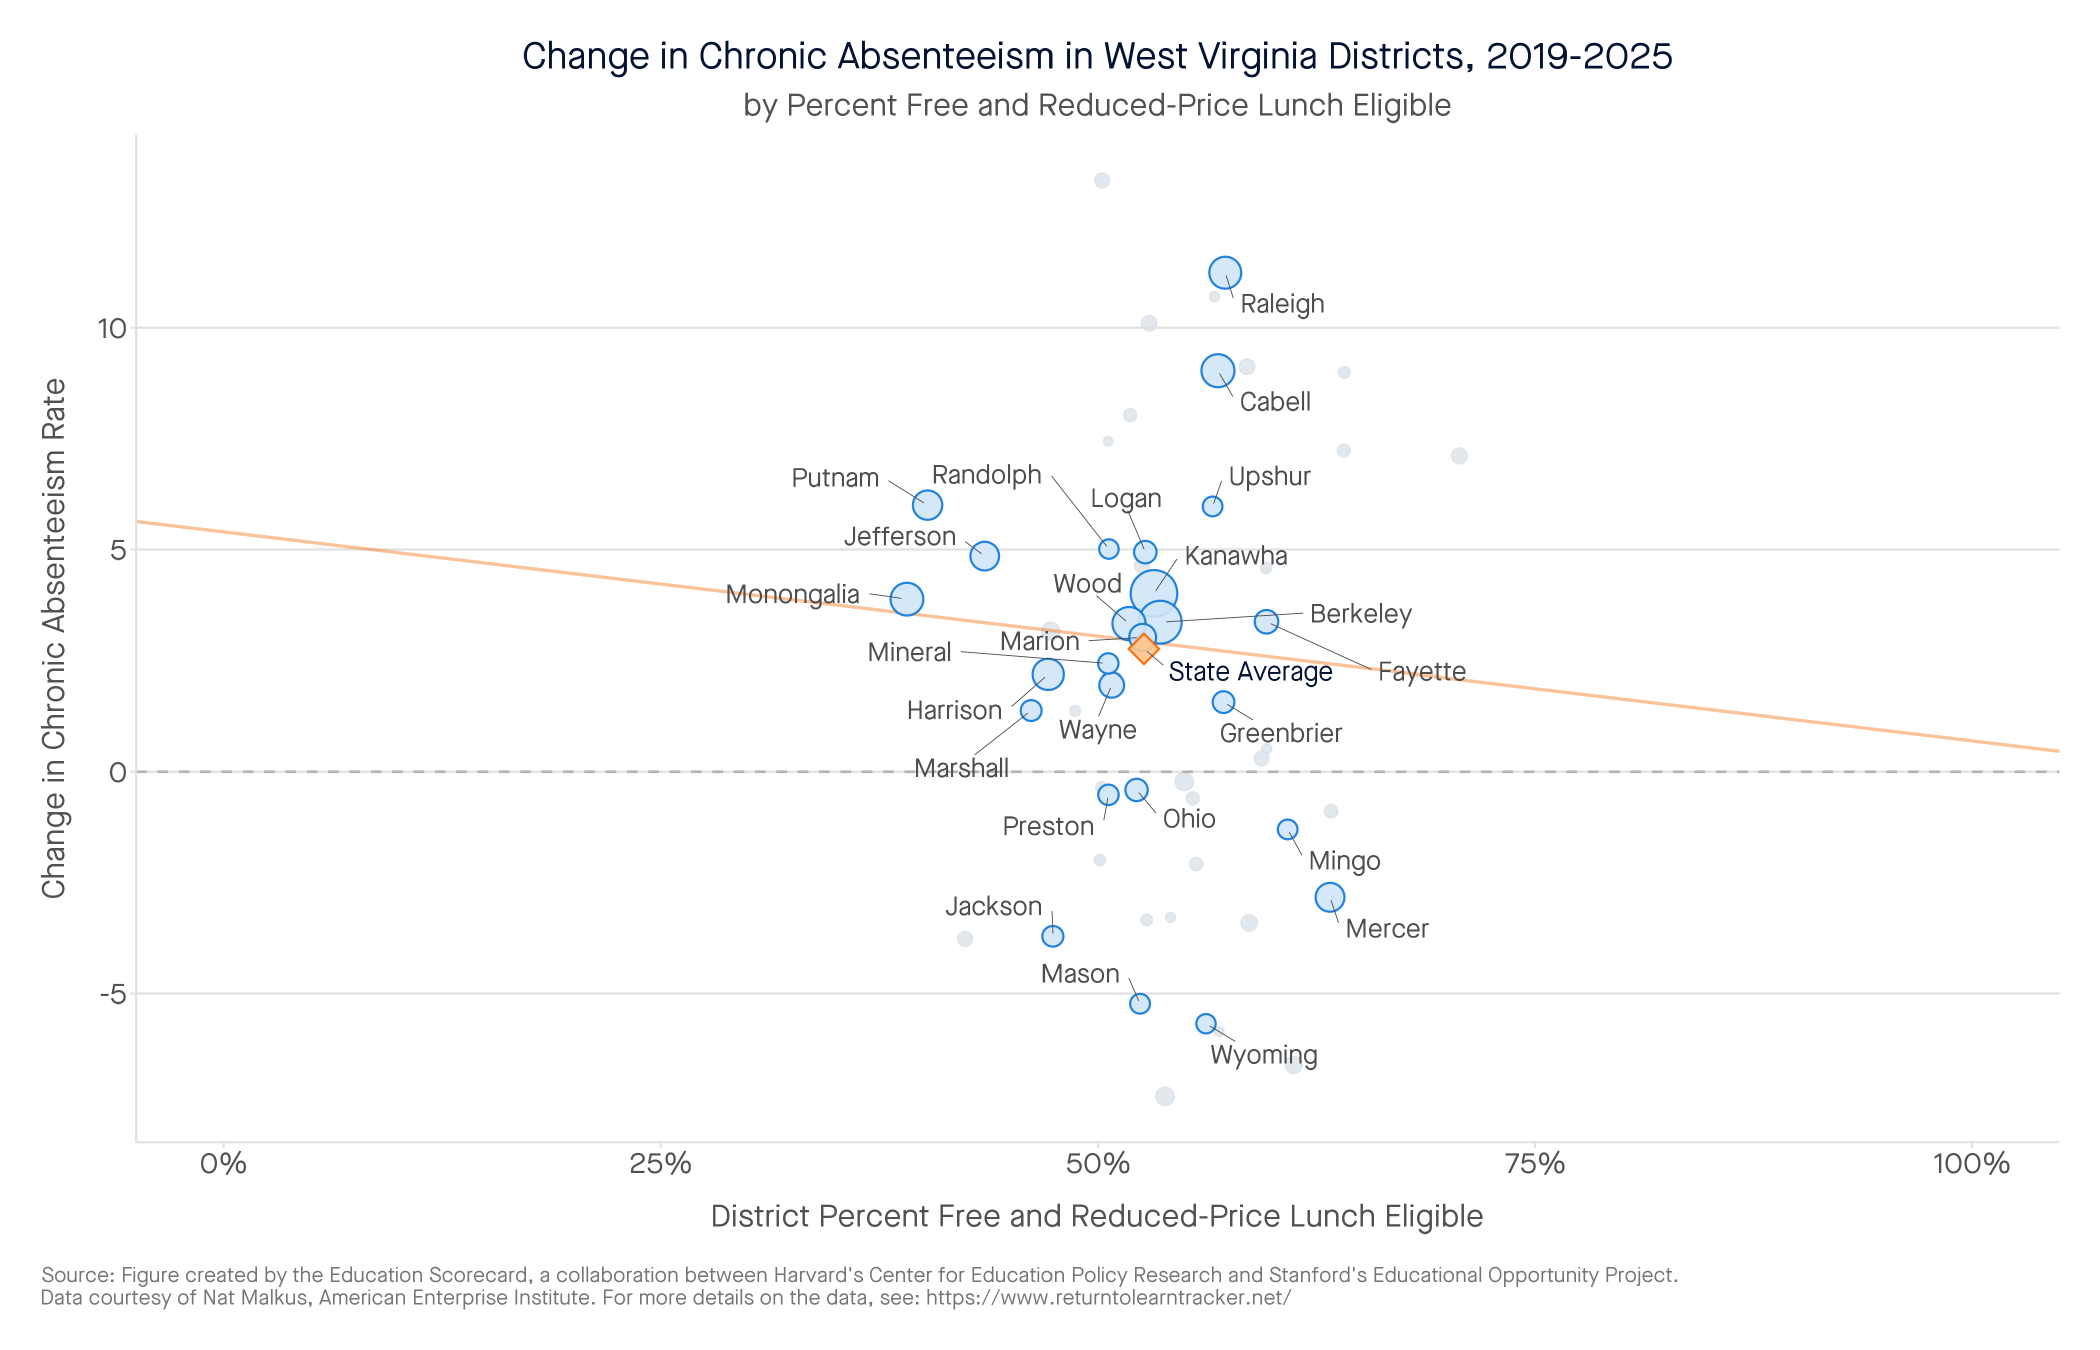
- Statewide, there is some good news on chronic absenteeism (students missing more than 10% of a school year), which has fallen from 29% in 2022 to 23% in 2025. However, chronic absence rates still remain four percentage points above pre-pandemic levels.
- West Virginia received about $1.2 billion in federal pandemic relief for K–12 schools—roughly $4,700 per student. Our analysis finds that the gains in many high-poverty districts were driven by this federal support. Unfortunately, many middle-poverty districts (those with 30 to 70 percent of students receiving federal lunch subsidies) received little federal aid. Now that the federal relief is gone, West Virginia should focus school improvement dollars on the middle and higher poverty districts that remain behind their pre-pandemic levels.
“The pandemic was the mudslide that followed seven years of erosion in student achievement,” said Professor Tom Kane, faculty director of the Center for Education Policy Research at Harvard University. “The ‘learning recession’ started a decade ago, after policymakers switched off the early warning system of test-based accountability and social media took over children’s lives. In this report, we highlight the work of a small group of state leaders who have started digging out by changing how students learn to read, and 108 local school districts that are finding ways to get students learning again. The recovery of U.S. education has begun. But it’s up to the rest of us to spread it.”
District on the Rise: Upshur County Schools
Among West Virginia’s math Districts on the Rise, Upshur County Schools (UCS) stands out for building a coherent, data-driven instructional system grounded in high-quality curriculum and deep community engagement. In mathematics, the district adopted Curriculum Associates’ Ready Math as its core curriculum, supported by the i-Ready diagnostic and benchmark assessment system, with Curriculum Associates staff providing learning walks, curricular workshops, and data review sessions directly with teachers. The district also participates in West Virginia’s math4life initiative, prioritizing conceptual understanding through manipulatives and hands-on learning. On literacy, a 2023 assessment of K–5 ELA instruction identified a gap in phonics instruction, prompting a shift to science-of-reading practices and adoption of the 95 Percent Literacy Intervention System, supported by job-embedded professional development from the 95 Percent Group. In 2025, elementary teachers completed LETRS training, and state-employed Literacy and Numeracy Coordinators visit monthly to analyze student data and target professional development. Instructional coherence is reinforced through Rigorous Curriculum Design principles and a data-meeting cadence launched by Superintendent Miller in 2023—first meeting monthly with each principal individually, then evolving to six-week professional learning communities. On attendance, the district uses Communities in Schools Coordinators to provide wraparound support for at-risk families, runs attendance competitions with community-donated prizes through its partnership with the Foundation for Better Schools, and has worked to build welcoming school environments where families see themselves as partners in learning. For the full case study, click here.
“One of the biggest strengths that we have in the community is the support from our families, and that the community values education,” said Christy Miller, Superintendent of Upshur County Schools. “There’s a concentrated effort and working together is what really makes the difference. In West Virginia, we have numeracy coordinators who work at the district level. They’re provided by the state’s Department of Education and come in and share good practices. They provide the district with information collected from classroom observations on what is going on in math instruction and we use this information to target professional development opportunities for our classroom teachers to strengthen their instruction with all of our students.”