PRESS RELEASE
May 13, 2026
Contact: Sam Stockwell
samuel_stockwell@gse.harvard.edu
617.495.0342
California Ranks 19th in Math Recovery and 29th in Reading Among States, with Bright Spots Emerging in Districts Across the State
Students remain more than a quarter grade level below 2019 levels in math, and over a third of a grade level behind in reading.
Chronic absenteeism has dropped significantly but remains 8 percentage points above pre-pandemic levels.
Districts like Compton Unified, Delano Union Elementary, and Ontario-Montclair are outperforming their peers in both math and reading.
(May 13, 2026) In its fourth year, the Education Scorecard (a collaboration between the Center for Education Policy Research at Harvard University, The Educational Opportunity Project at Stanford University, and faculty at Dartmouth College) is issuing its annual report on district-level student growth in math and reading.
The latest report provides a high-resolution picture of where California students’ academic recovery stands, combining state test results for roughly 35 million grade 3–8 students nationwide with national assessment data to describe changes in local communities. Here’s what we found:
California:
- California ranks 19th out of 38 states in academic growth in math and 29th out of 35 states in reading between 2022 and 2025.
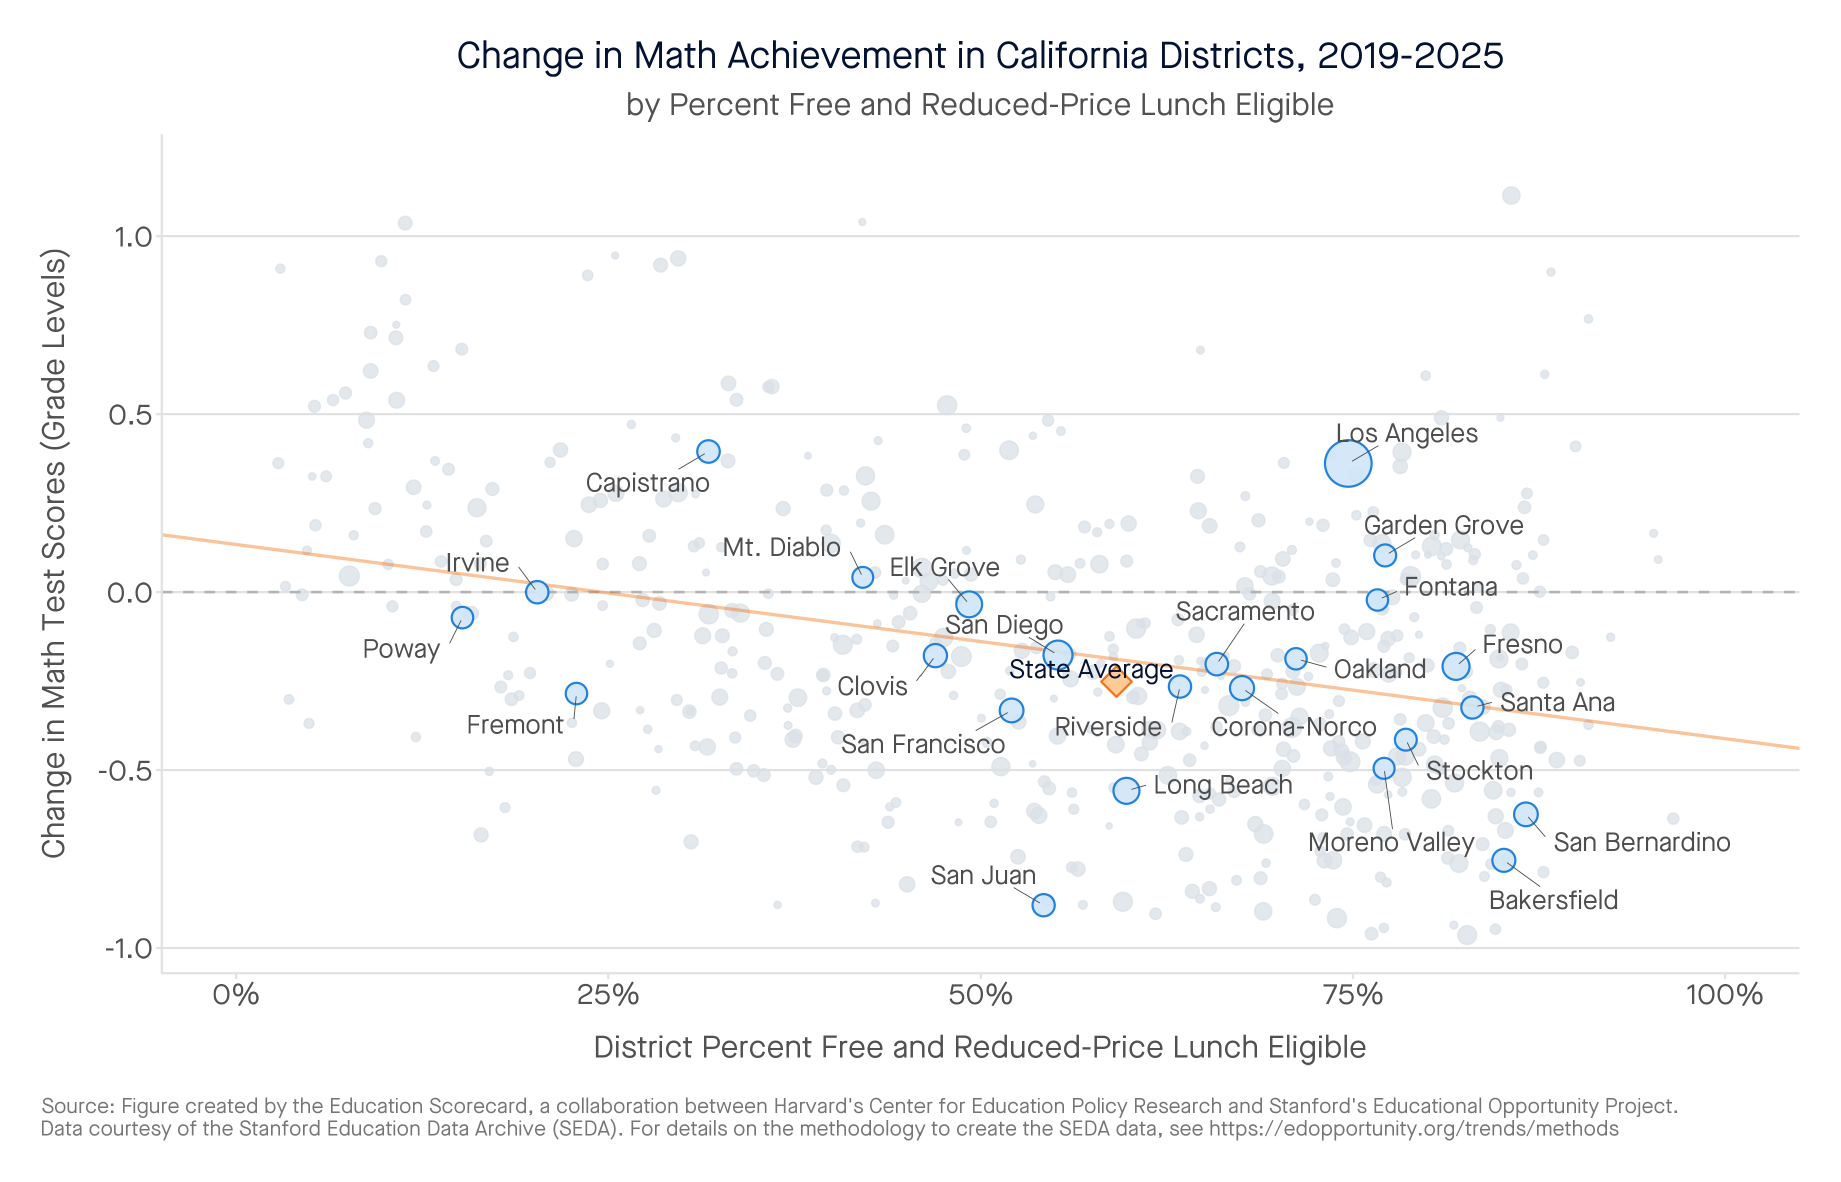
- In math, the average student is performing .17 grade equivalents above their 2022 level, but over .25 grade equivalents below 2019 levels. Some districts like San Juan, Bakersfield, San Bernardino, and Long Beach continue to lag significantly—over half a grade equivalent—behind 2019 levels.
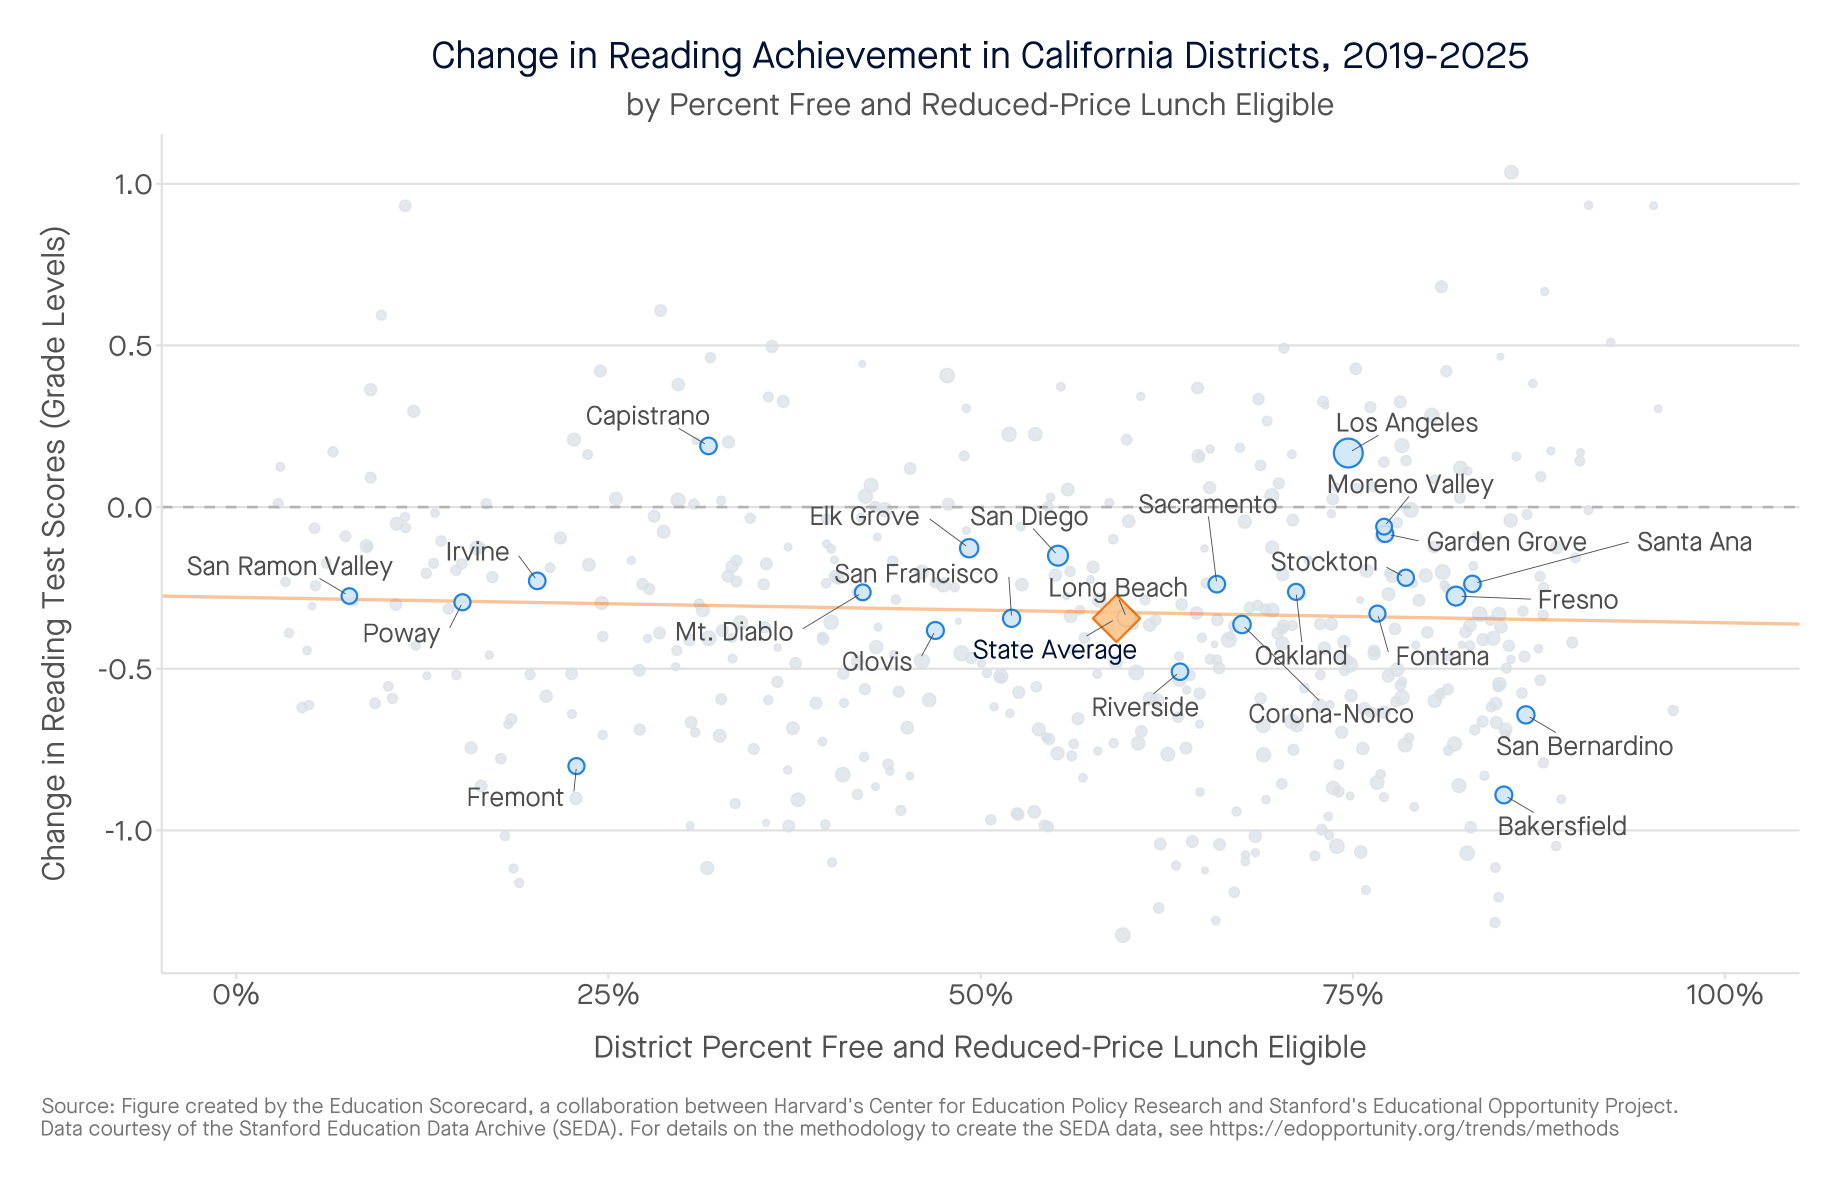
- In reading, the average student is performing .23 grade equivalents below their 2022 level, and .34 grade equivalents—over a third—below 2019 levels. A number of districts like Fremont, Bakersfield, and San Bernardino continue to slip and remain over half a grade equivalent behind their 2019 levels.
- Several California districts are emerging as Districts on the Rise. These districts have shown unusual progress relative to similar districts in their own state. A core group of districts is excelling in both math and reading, with districts like Compton Unified, Delano Union Elementary, and Ontario-Montclair outperforming their peers.
- Several other districts are rising relative to their peers in one subject—either math or reading. Modesto City Elementary, Oxnard, Kings Canyon Joint Unified, Little Lake City Elementary, and Sanger Unified are leading the way in math performance, while Orange Unified, Bonita Unified, Berkeley Unified, and San Carlos Elementary school districts are leading the way in reading.
- Statewide, there is some good news on chronic absenteeism (students missing more than 10% of a school year), which has fallen from over 30% in 2022 to less than 20% in 2025. However, chronic absence rates remain about 8 percentage points above pre-pandemic levels.
- California received about $23.4 billion in federal pandemic relief for K–12 schools—roughly $4,000 per student. Our analysis finds the gains in many high-poverty districts were driven by this federal support. Unfortunately, many middle-poverty districts (those with 30 to 70 percent of students receiving federal lunch subsidies) received little federal aid. Now that the federal relief is gone, California should focus school improvement dollars on the districts that remain behind their 2019 levels.
“The pandemic was the mudslide that followed seven years of erosion in student achievement,” said Professor Tom Kane, faculty director of the Center for Education Policy Research at Harvard University. “The ‘learning recession’ started a decade ago, after policymakers switched off the early warning system of test-based accountability and social media took over children’s lives. In this report, we highlight the work of a small group of state leaders who have started digging out by changing how students learn to read, and 108 local school districts that are finding ways to get students learning again. The recovery of U.S. education has begun. But it’s up to the rest of us to spread it.”
Professor Sean Reardon, faculty director of the Educational Opportunity Project at Stanford University and developer of the Stanford Education Data Archive, said, “From the early 1990s through 2013, public elementary and middle school students’ math and reading skills improved dramatically––by more than two grade levels in math, for example––and racial/ethnic achievement disparities narrowed. That shows that we can improve our public schools and equalize educational opportunity. But we haven’t been doing much of that for the last decade. It’s time now to make our public schools once again the engine of the American Dream.”
District on the Rise: Modesto City Elementary School District
Among California’s Districts on the Rise, Modesto City Elementary stands out for its combination of instructional coherence and deliberate planning. The district built a three-year Instructional Core Framework with teacher and principal input, funded LETRS literacy training for all teachers, and adopted SWUN Math with embedded coaching at every school. Crucially, Modesto planned ahead for the expiration of ESSER funds—training in-house math coaches to sustain the program and deploying dedicated math-support substitutes at its lowest-performing schools year-round, freeing classroom teachers to work with small groups. For the full case study, click here.
“The improvement in math and reading scores is a reflection of focused work by our teachers and school administrators,” said Dr. Vanessa Buitrago, Superintendent, Modesto City Schools. Beyond just monitoring patterns in achievement data, our educators closely adhere to our instructional core, a teaching model that emphasizes support for all learners and ensures equitable access for all students to rigorous content standards. We are very proud of these achievements, but we also know that there is far more to do. While test scores are just one way to measure learning, they are an important metric, so we want test scores to rise further in the years to come, across all grade levels.”
Additional Spotlights:
Compton Unified School District— For the full case study, click here.
Monterey Peninsula Unified School District— For the full case study, click here.